Maqueta, Real Places Rebuilt in 3D from Fused Open Geodata
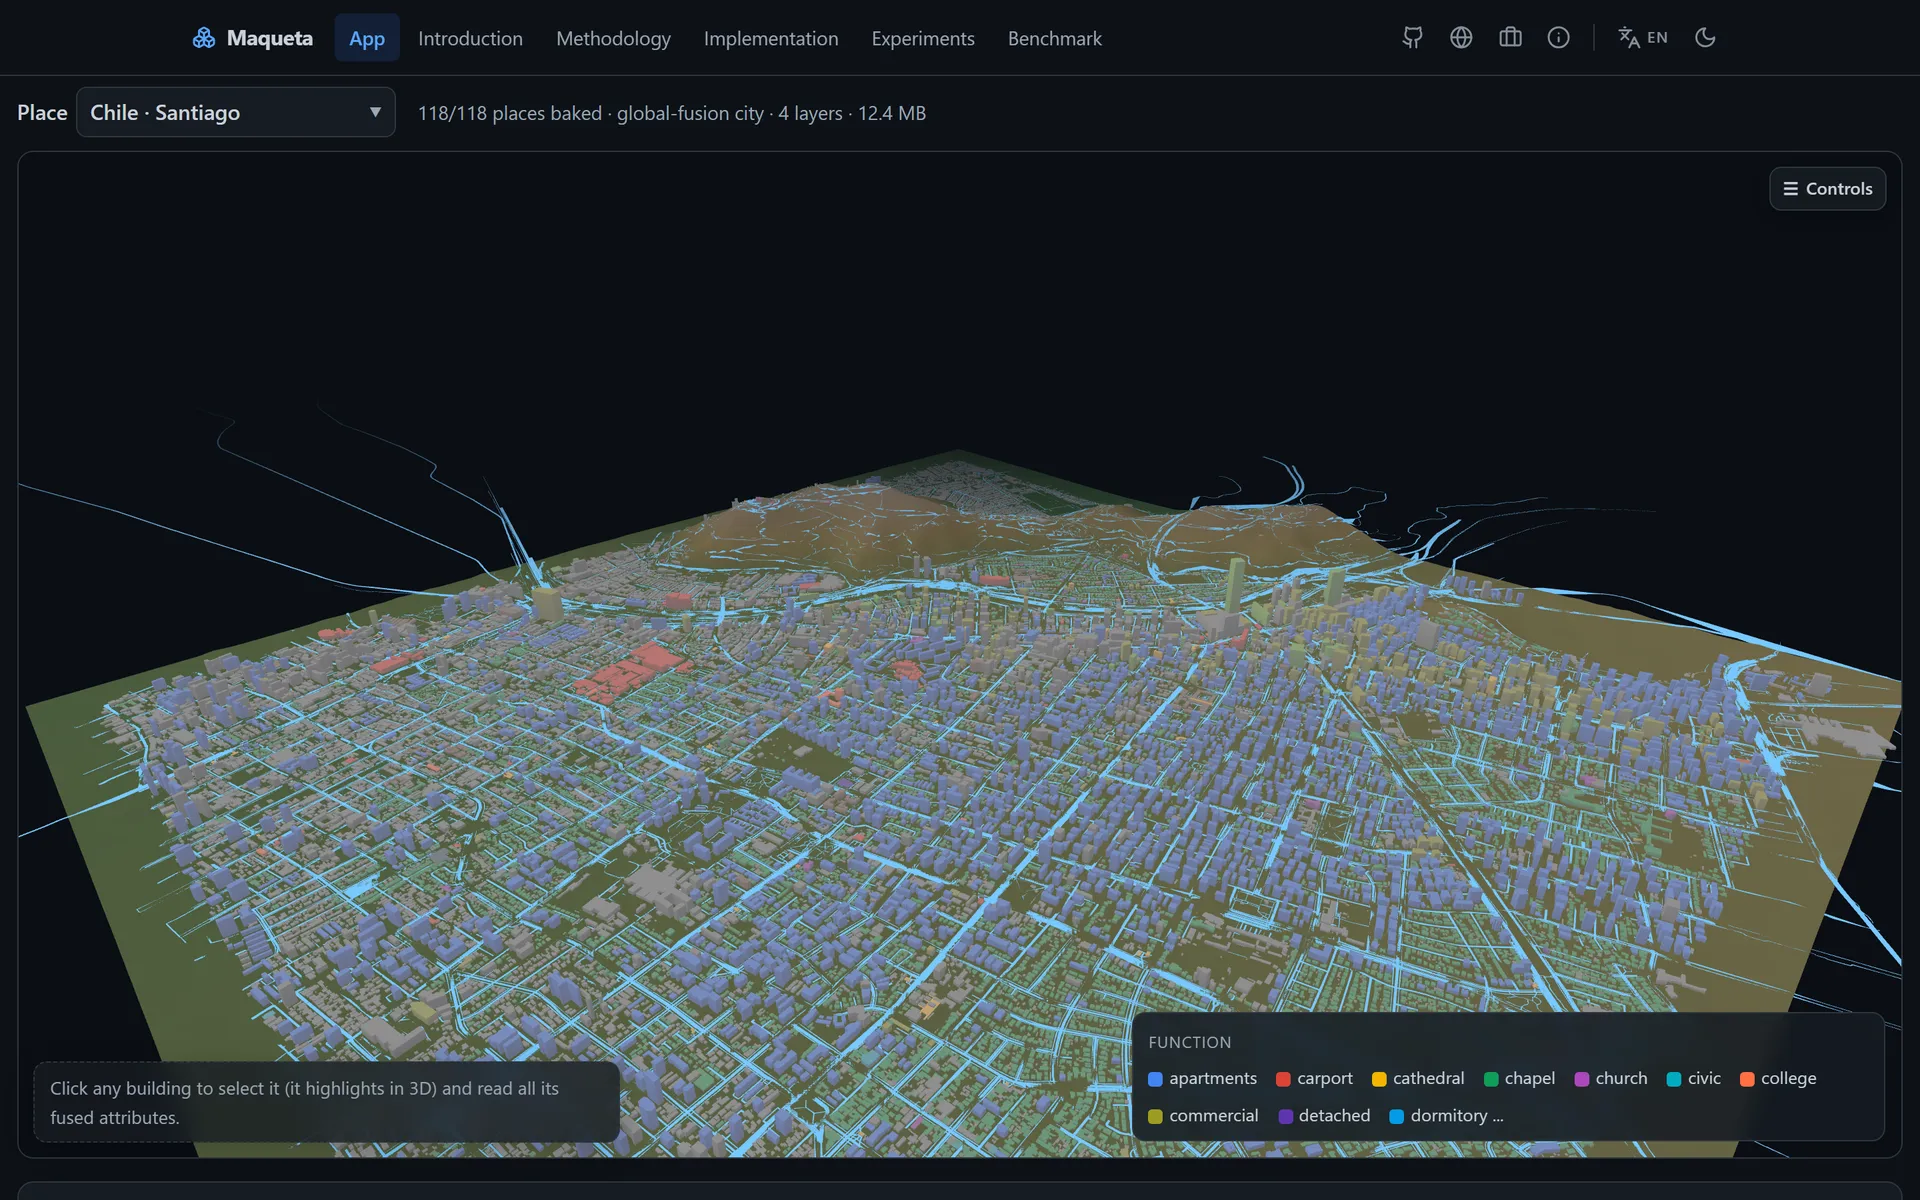
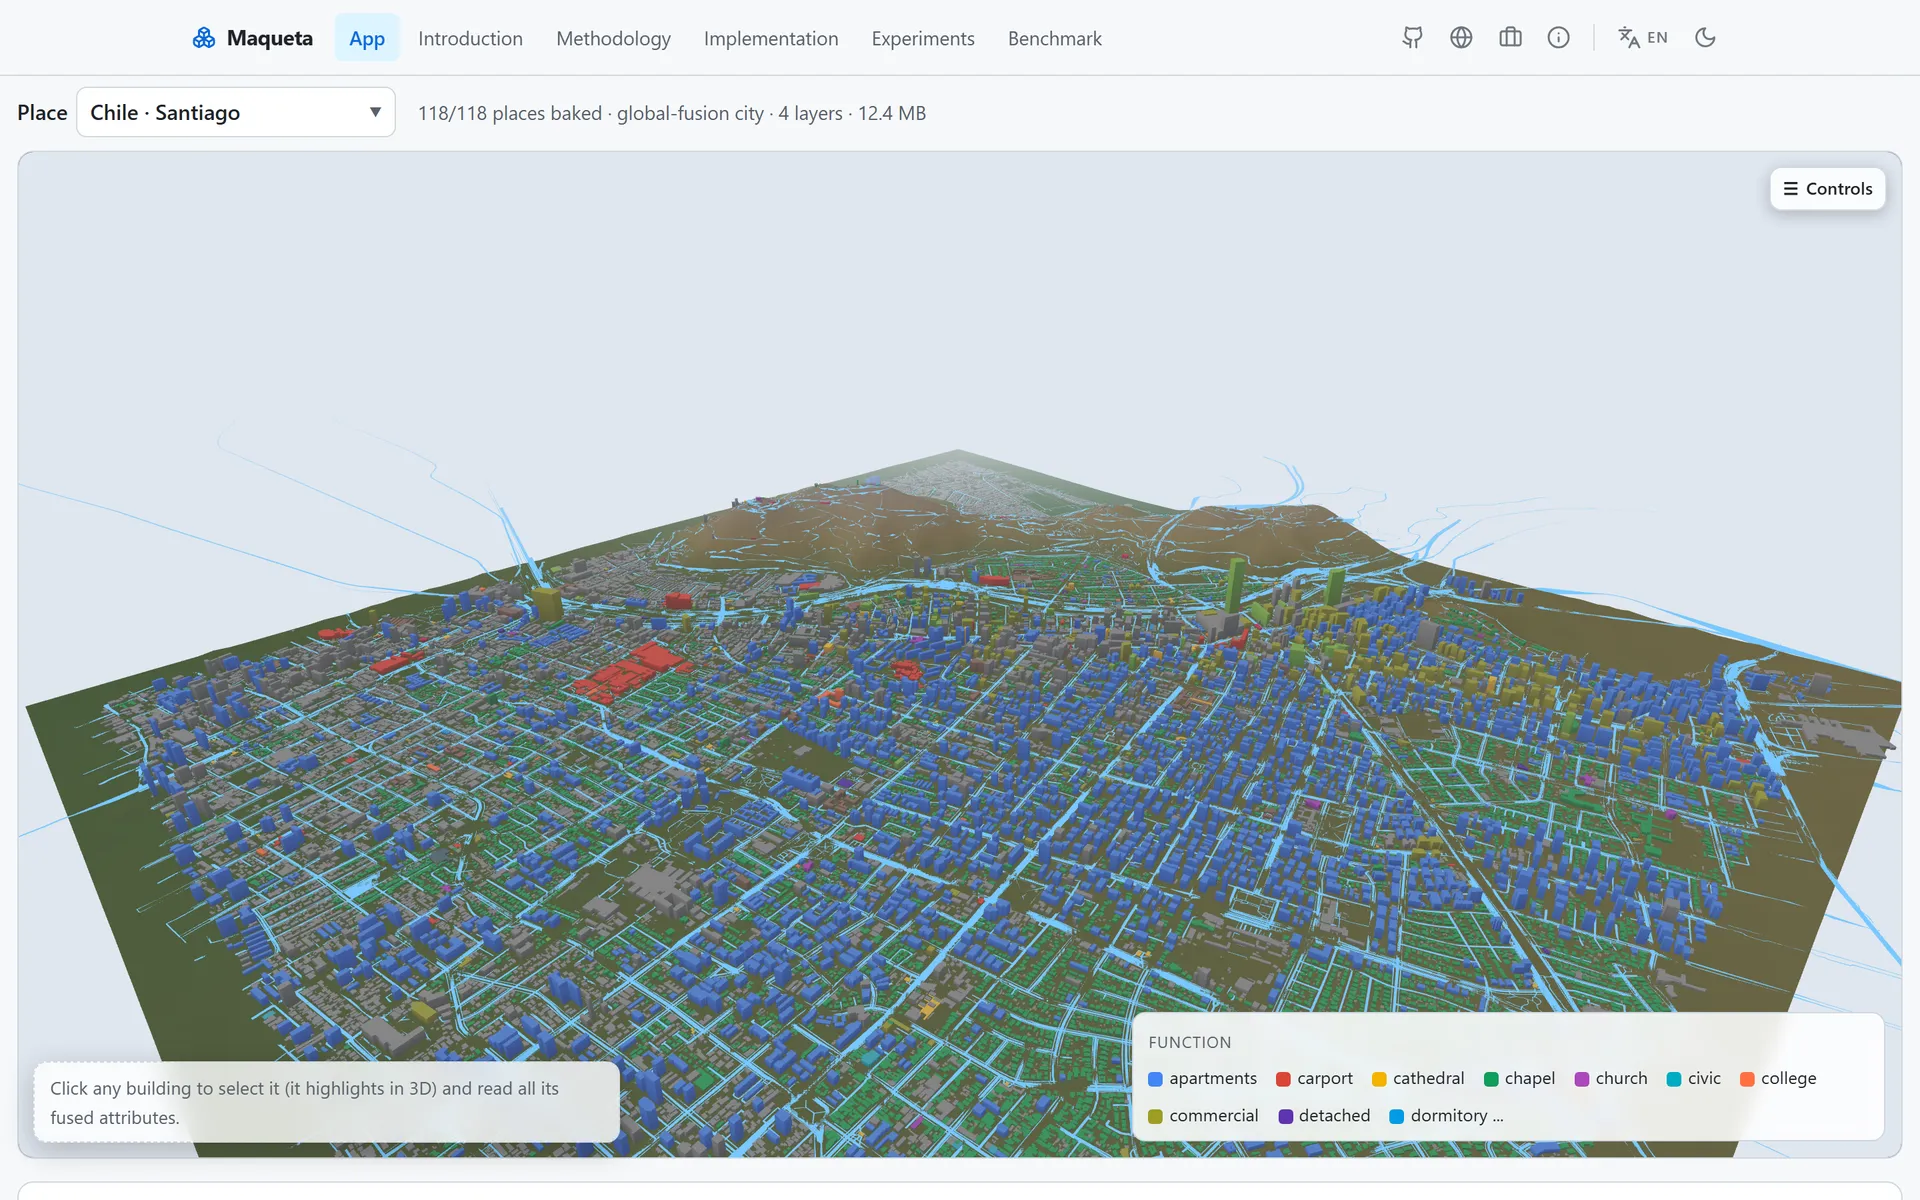
Take a real area and rebuild it in 3D from public, open geodata, with the height map as the way in. Maqueta fuses Overture buildings and roads, Copernicus GLO-30 terrain, ESA WorldCover land cover, OpenStreetMap water, green and rail, GHS-POP population, Google Open Buildings 2.5D heights, 3DBAG LoD2 as an official reference layer and SoilGrids soil carbon; every layer keeps its source and licence visible, and every building height carries its provenance: measured, inferred from floor count, read from a height raster, or a default. 118 places baked and served, from cities on every continent to Santiago split into its 37 comunas as separate cases. Colour and filter buildings by any fused attribute, click one to read everything fused into it, drape a cloudless Sentinel-2 image, and draw a polygon over any sub-area to summarise the buildings inside: count, footprint area, built coverage, density, height distribution, floors, and the mix of function, land cover and height provenance. The fusion engine is the separately published geoscena package.
Business Context
Urban, environmental and real-estate questions are mostly questions about one area seen through several sensors and registers: how dense, how tall, how green, how built, how populated, and how each of those compares with the area next door. Maqueta answers them on open data with the source and licence on screen, so a planner, a researcher or a journalist can quote the number and the provenance together, and can see when a height is a model rather than a measurement. It grew out of Atalaya, an explorer of the Chilean Data Observatory catalogue, from noticing that many separately published variables describe the same territory. It is a base for a wider project, built on open data and open code, and offered as such.
Strategic Value
Maqueta is the case in the line where the first deploy was called a toy and the product was rebuilt to the bar in the same week: one city with flat colours, no streets and no interaction became the fused workbench, and the analytical layer (satellite imagery, per-building indices, sub-area statistics and comuna choropleths) was planned, validated and built afterwards rather than promised. Its engine lives in its own published package because acquisition and fusion of public geodata into a scene bundle is domain-agnostic; the product declares no package of its own. Heights are modelled where no measurement exists and the provenance says so per building; the reference LoD2 layer is the check where an official city model exists.
The Challenge
Public geodata about the same square kilometre is published by different institutions, in different formats, under different licences, and each describes one facet: what the land is covered with, how high the ground is, where the buildings and streets are, how many people live there, how tall the buildings probably are. Reading any of them alone is easy. Asking a question that crosses them, how the footprint area or the height of buildings is distributed in one neighbourhood, how land use splits between residential, commercial and industrial inside a boundary that matters to you, how vegetation or built cover compares between two comunas, needs the layers aligned on one geometry first, and needs the answer to say where each number came from and how much of it is measured rather than modelled.
Our Approach
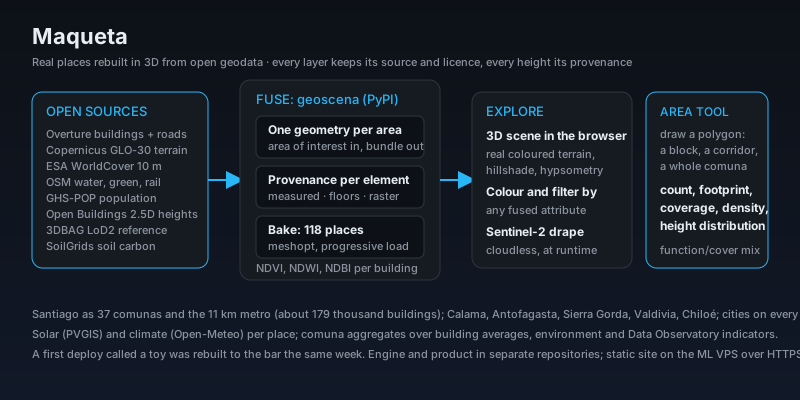
geoscena, a separately published package from its own repository, does the acquisition and fusion: given an area of interest it fetches every source family and fuses them into one scene bundle on a common geometry, with provenance on every element. Maqueta is the product: a pipeline that bakes 118 places (the count the live site reports) into compressed, progressively loaded scenes (meshopt compression, terrain hillshade and hypsometric colour), and a Three.js workbench that renders them with the real coloured terrain. Per-building attributes carry height and its provenance (measured, inferred from floors, read from a raster, or default), footprint area, floor count, function, roof shape and land cover; multispectral indices (NDVI, NDWI, NDBI) are sampled per building in the bake, and an environment layer adds solar (PVGIS) and climate (Open-Meteo) per place. A cloudless Sentinel-2 drape (EOX, CC-BY) is fetched at runtime per area. The area tool takes a polygon over any sub-area, a block, a corridor, a whole comuna, and summarises the buildings inside; the comuna aggregation spans building averages, the environment layer and Data Observatory indicators. A searchable, categorised picker opens on Providencia by default, with Santiago as 37 comunas and the 11 km metro as one case of about 179 thousand buildings.
Key Performance Indicators
| KPI | Baseline | Result | Impact |
|---|---|---|---|
| One geometry, every layer, provenance on each | Nine sources in nine formats and licences | Buildings, roads, terrain, land cover, water, green, rail, population, modelled heights, LoD2 reference and soil carbon fused per place, with source, licence and per-building height provenance visible | A number can be quoted with where it came from |
| The question that started it, answered | No way to summarise a neighbourhood across layers | Draw a polygon over any sub-area and read count, footprint area, built coverage, density, height distribution, mean and median height, floors, and the mix of function, land cover and height provenance; compare comunas by drawing over each | Sub-area statistics on open data, in the browser |
| A first deploy called a toy, rebuilt to the bar | One city, flat colours, no streets, no interaction | 118 places with rich per-building attributes, real coloured terrain, satellite drape, indices, environment and an area tool; the analytical layer planned and validated before it was built | The rebuild is the record, not the excuse |
Architecture
maqueta pipeline
Technology Stack
Application Screenshots