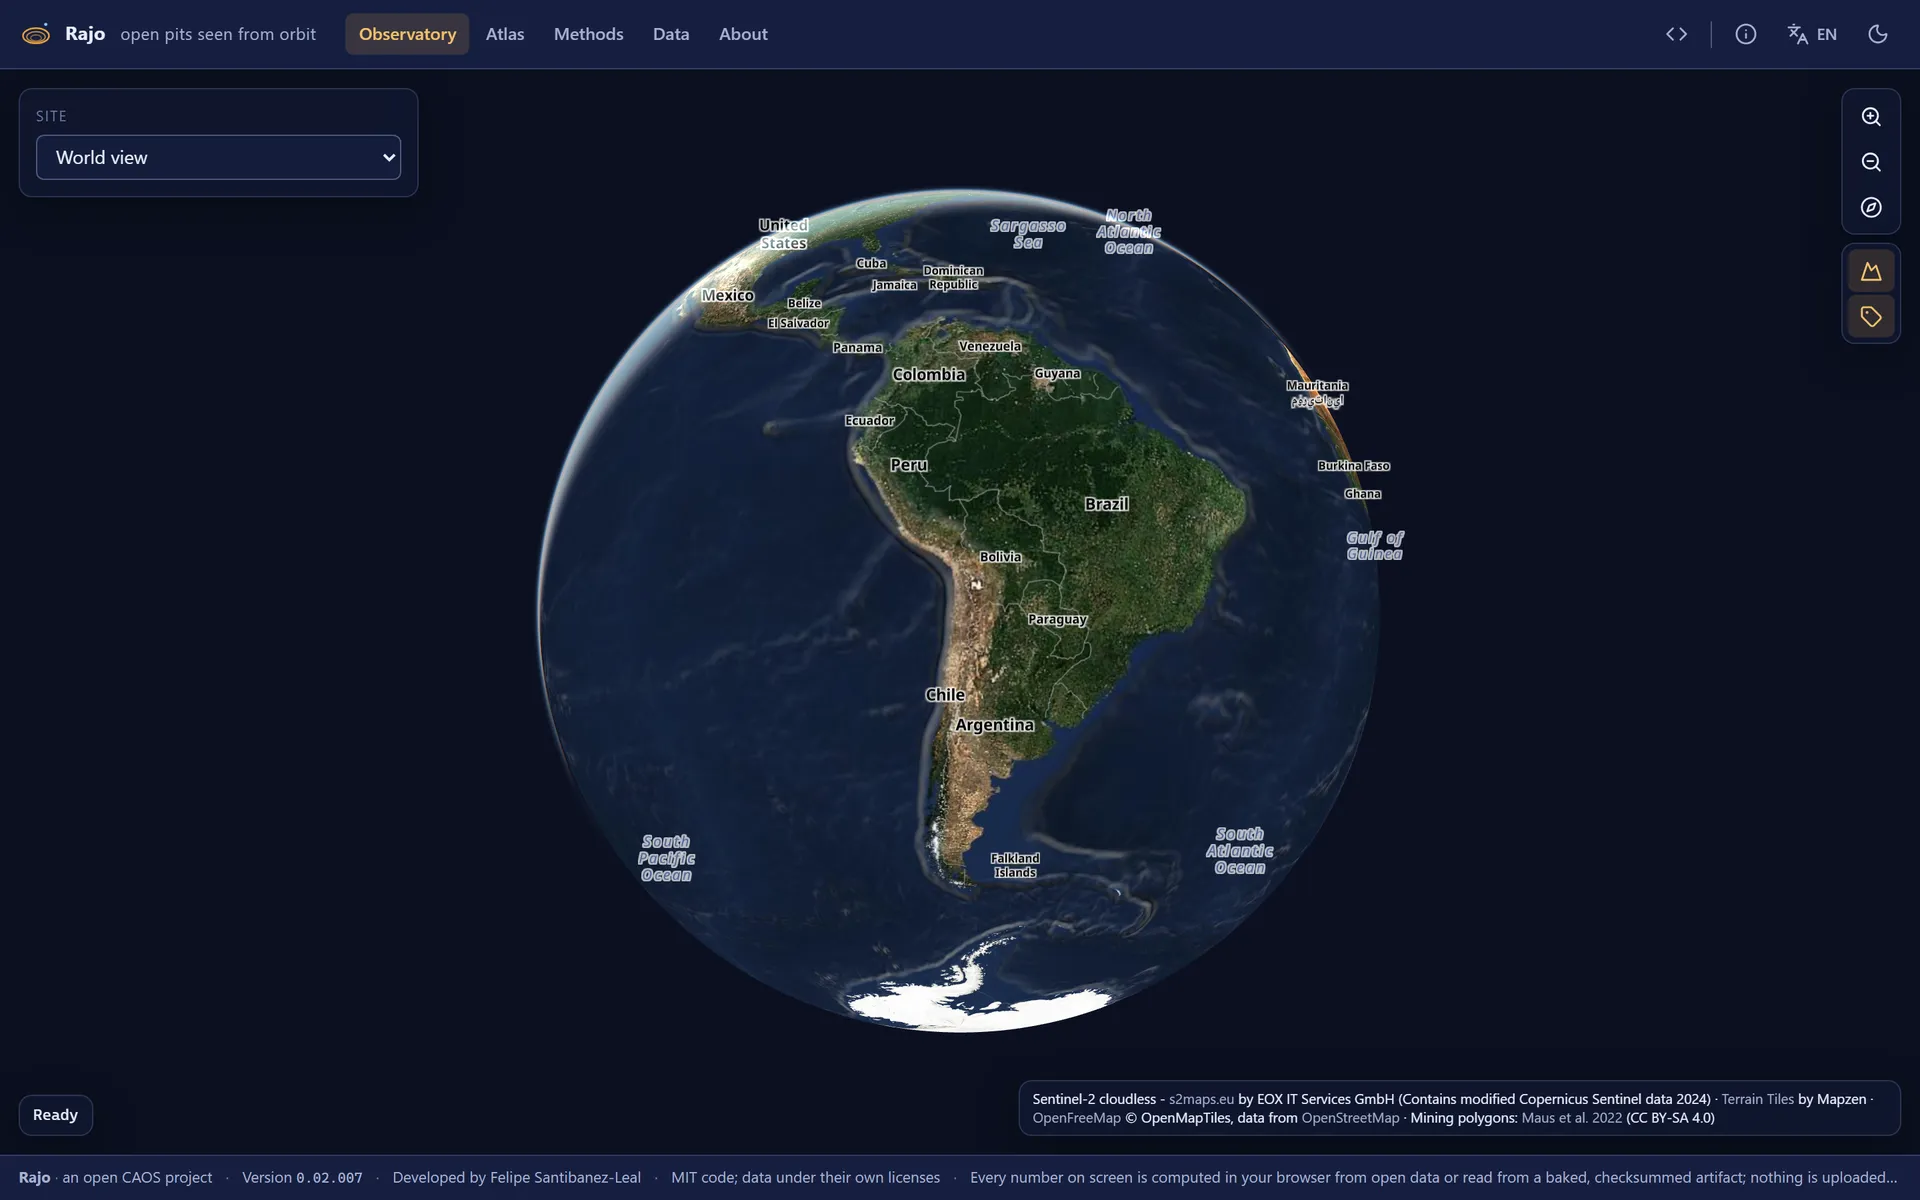
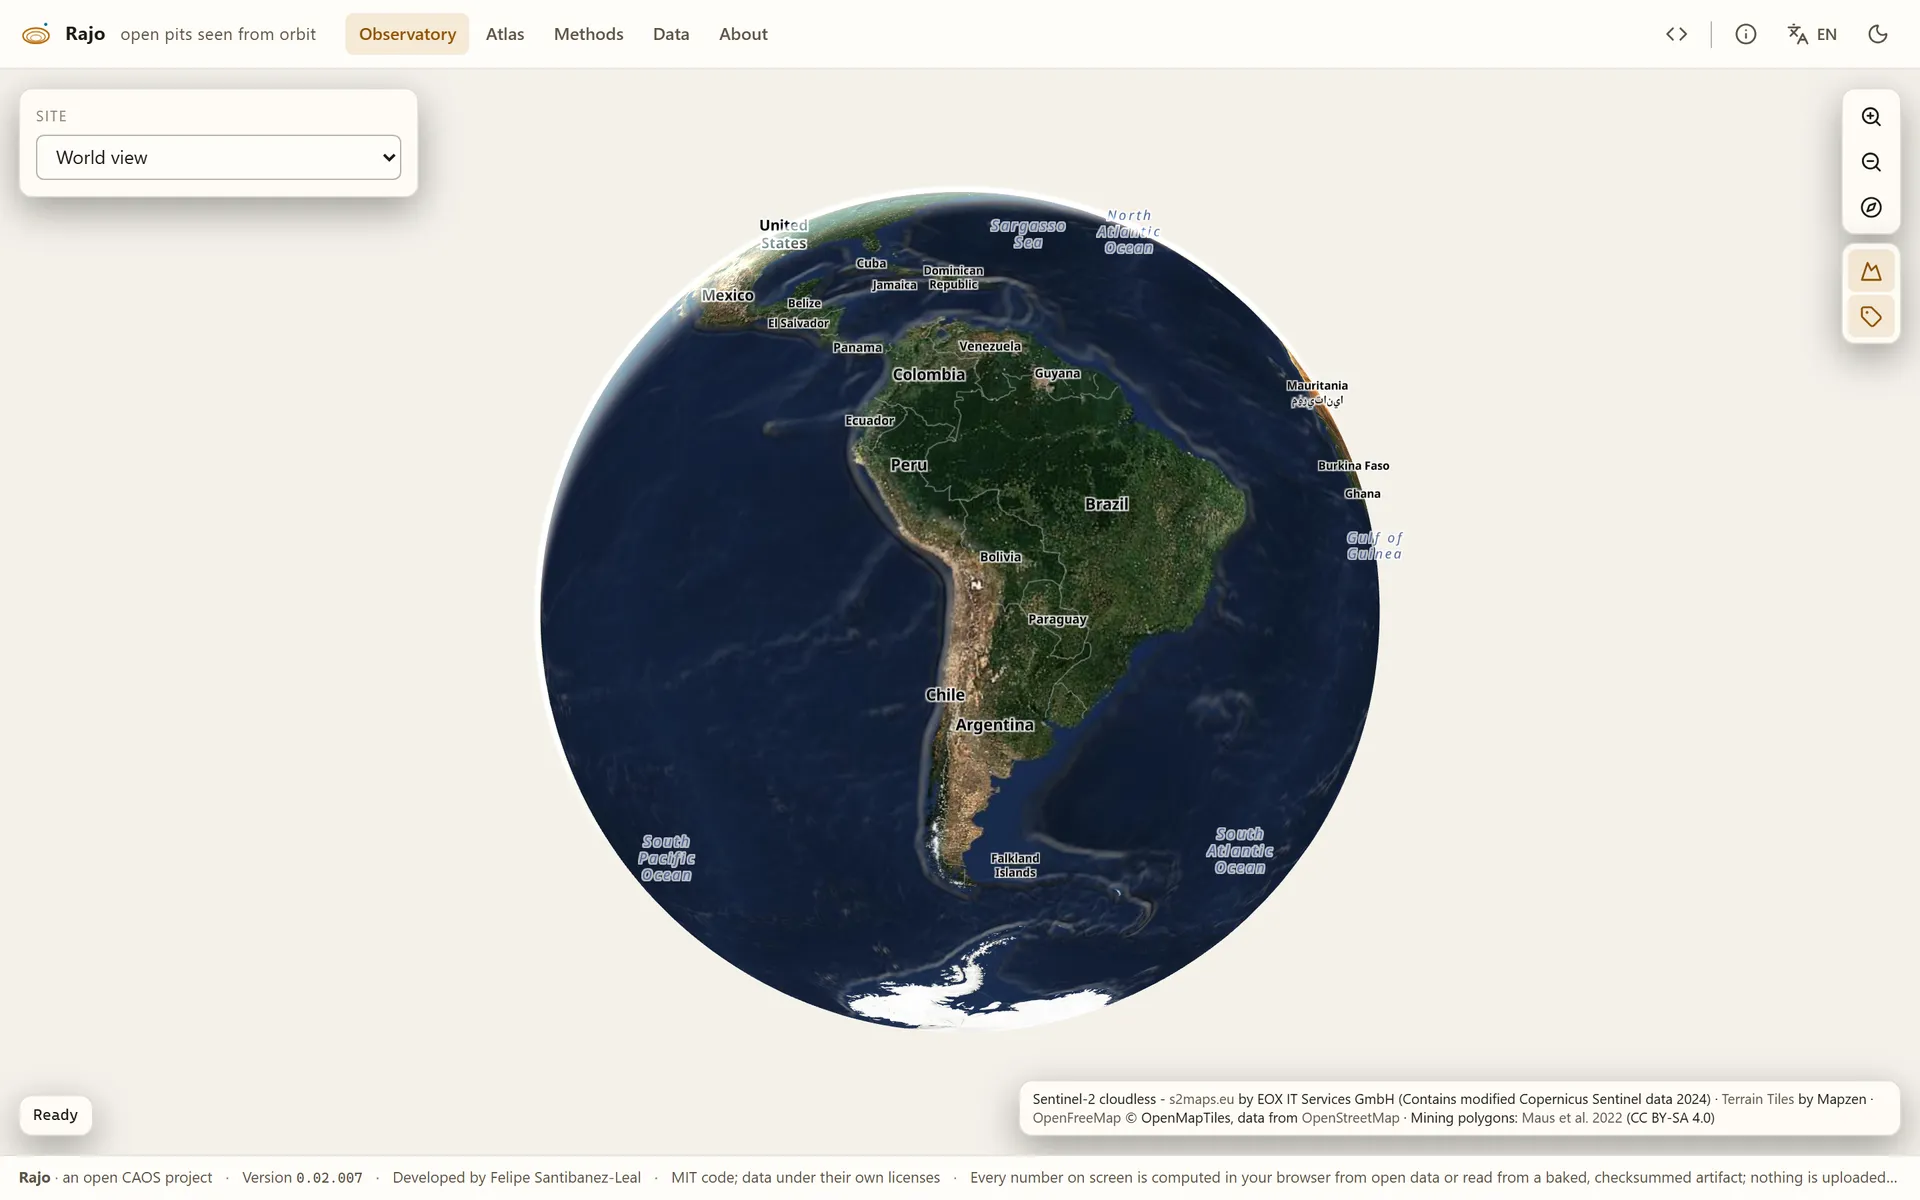
Rajo, Open Pits Seen from Orbit
An open observatory of the world's great open-pit mines and lithium evaporation ponds over four decades: a 3D globe with real relief, a yearly time-lapse per site from Landsat 1985 to Sentinel-2 today, spectral and mineral indices computed live in the browser from the raw cloud-optimized GeoTIFFs, a learned mine-footprint segmentation running in the browser, change points on the mined-area signal, and the elevation difference between the 2000 and the 2011 to 2015 global surfaces. Thirty sites, Chilean copper at the core; no backend, no account, nothing uploaded.
Business Context
For a reader the product answers, per site, four questions the Atlas and the Observatory are built around: what am I looking at, how did it grow, where did the rock go, and how sure is the mask. Every number on screen traces to a computation that can be rerun in the browser or to a named, dated source: Cochilco and the operators' own disclosures on the site cards, the USGS copper table by country on the Atlas, the held-out benchmark on the Methods page. It is a research showcase built on Felipe's own visual identity rather than the shared CAOS shell, by his explicit instruction.
Strategic Value
Rajo is live at its own domain as a vps-static deploy since 2026-09-03 and serves version 0.02.007: the four lanes on the thirty sites, the complete dense series, the Spanish surface written with its accents and its numbers formatted in the reader's locale, each held by a gate in CI. The plan keeps its lifecycle at planned because Felipe has not moved it; the deployment facts are recorded as measured. The workflow trigger defect it found (push runs that never registered until the workflow file was renamed) is now a fleet-wide finding.
The Challenge
Open-pit mines are among the largest objects people build, and their growth is recorded in public satellite archives going back forty years, yet nobody can watch a pit grow, measure its footprint or see how much rock moved without a GIS licence and a week of downloads. The reference polygons exist (Maus 2022, Tang and Werner 2023), the imagery is open (Landsat Collection 2, Sentinel-2 L2A as cloud-optimized GeoTIFFs), the elevation models are open (SRTM, Copernicus DEM), and none of it is joined into something a reader can open.
Our Approach
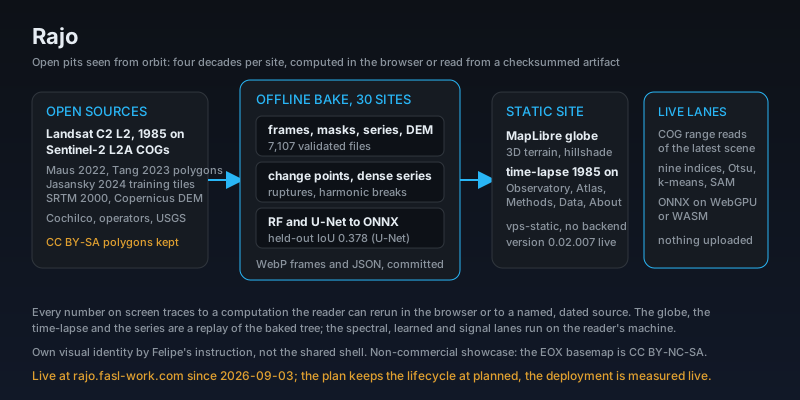
An offline pipeline bakes, for each of thirty sites, the yearly frames from 1985 to today (Landsat, then Sentinel-2), the classical and learned masks, the mined-area series with its change points (ruptures), the dense series of every clear Sentinel-2 date since 2017 with its harmonic breaks, and the elevation difference between the year-2000 radar surface and the 2011 to 2015 Copernicus surface; 7,107 files, validated and checksummed, committed as compact WebP frames and JSON. Two models are trained on the Jasansky 2024 tiles and exported to ONNX: a random forest walked from flat node arrays and a U-Net on WebGPU or WASM. The site is a static replay of those artifacts on a MapLibre globe with 3D terrain, plus three live lanes in the browser: range reads of the latest clear Sentinel-2 scene, nine indices with Otsu, k-means and spectral angle in a Web Worker, and the two learned masks through onnxruntime-web.
Key Performance Indicators
| KPI | Baseline | Result | Impact |
|---|---|---|---|
| Four decades per site, replayed and measured | Satellite archives as records in portals | 30 sites, yearly frames 1985 to today (Landsat then Sentinel-2), the dense Sentinel-2 series since 2017 with harmonic breaks, mined-area series with change points, 7,107 validated files | A pit's growth is a curve a reader can scrub, not a folder of downloads |
| A learned footprint, benchmarked on held-out tiles | A mask nobody scored | U-Net test IoU 0.378 and 0.502 on the catalog, random forest beside it, both exported to ONNX and run in the browser; the classical masks (Otsu, k-means, spectral angle) on the same axes | The mask says how sure it is instead of pretending |
| Nothing leaves the browser | A server, an account, an upload | No backend and no secret at runtime: range reads of the Sentinel-2 COGs, band math in a Web Worker, ONNX inference on WebGPU or WASM, a static release on the VPS with the last three releases kept | Open data stays open on the way to the reader |
Architecture
rajo pipeline
Technology Stack
Application Screenshots